SOME NEW OUTCOMES OF THE
INTERMEDIATE TERM EARTHQUAKE PREDICTION IN VIỆT NAM
1CAO ĐÌNH TRIỀU, 2GIULIANO
F. PANZA, 2A. PERESAN, 2F. VACCARI,
2F. ROMANELLI, 1NGUYỄN HỮU TUYÊN, 1PHẠM
NAM
HƯNG,
1LÊ VĂN DŨNG, 1MAI XUÂN BÁCH, 1THÁI ANH TUAN, 3CAO
ĐÌNH TRỌNG
1Institute of Geophysics, VAST, 18
Hoàng Quốc Việt, Cầu Giấy, Hà Nội;
2Department of Earth
Sciences, University of Trieste, Italy;
3Peoples Friendship University of Russia
Abstract: In this paper
the authors present some new results in the use of CN, M8, and M8S algorithms
for intermediate-term earthquake prediction in Việt Nam. The following conclusions can
be made:
1.
Three from 4 events were recognized by CN algorithm with the catalogue of
1964-2000 and one TIP was made since 2001 with the duration of 5 years. This
event (M6.2) occured in Oct. 3rd, 2003 (coordinates: 21°27 N; 101°51
E).
2. One TIP with magnitude of more than 5.5
can be made since 2006 in Extended NW Việt Nam with the catalogue of 1964-2005,
using CN algorithm.
3. M8 algorithm can be effectively used for
earthquake prediction with the M7.0+ in SE Asia: the great Sumatra earthquake
M9.0 (26/12/2004) was predicted on the basis of earthquake catalogue to the end
of 2003 (R= 667 km and R= 3000 km); Java earthquake M7.7 (17/7/2006) was
predicted on the basis of earthquake events to the end of 2005 (R= 281 km); and
South Taiwan M7.1 (26/12/2006) also has been predicted on the basis of events
to the end of 2005.
4.
Extended M8, M8S algorithm is the one that can be effectively used for
earthquake prediction in Việt Nam:
the Tuần Giáo earthquake M6.7 (24/6/1983)
was predicted on the basis of earthquake events to the end of 1980, with the
duration of TIP's from 1981 to 1986.
5. During the time from 2006 to 2010, the
danger of having earthquake M6.5+ occurs in the regions of NW Lao and N Hà
Giang province, using M8S algorithm.
I. INTRODUCTION
The
United States National Research Council, Panel on Earthquake Prediction of the
Committee on Seismology suggested the following definition of the earthquake
prediction [5]: “An earthquake prediction must specify the expected magnitude
range, the geographical area within which it will occur, and the time interval
within which it will happen with sufficient precision so that the ultimate
success or failure of the prediction can readily be judged. Only by careful
recording and analysis of failures as well as successes can the eventual
success of the total effort be evaluated and future directions charted.
Moreover, scientists should also assign a confidence level to each prediction”.
The
stages of earthquake prediction are divided into: term-less prediction of
earthquake-prone areas; and prediction of time and location of an earthquake of
certain magnitude (Table 1). The Gütenberg-Richter law suggests limiting
magnitude range of prediction to about one unit. Otherwise, the statistics
would be essentially related to dominating smallest earthquakes.
The most recent researches focused on the maximum earthquake occurrences
in Việt Nam
territory which was carried out in the publications of Cao Đình Triều and
Nguyễn Đình Xuyên [1-4, 13]. The primary results of the International Project
cooperation between Institute of Geophysics and Trieste University for
2002-2005 periods defined that the highly seismic risk with the frequencies and
intensity may occur in the region with magnitude of about 6.0- 7.0. The lasted
results of the 10.EE.1 Project are not only upgrading the new information in
studying the seismic hazard, but also more fruitful and significant to launch a
new approach in earthquake prediction.
Table 1. Classification of
earthquake prediction
|
Temporal, in
years
|
Spatial, in
source zone size L (km)
|
|
Long-term
10
|
Long-range
up to 100
|
|
Intermediate-term
1
|
Middle-range
5-10
|
|
Short-term
0,01 - 0,10
|
Narrow
2-3
|
|
Immediate
0,001
|
Exact
1
|
In this paper the authors describe some new results of the
intermediate-term earthquake prediction in Việt Nam on the basis of the CN and
M8-M8S algorithms.
II. APPLICATION OF THE CN ALGORITHM FOR
INTERMEDIATE-TERM EARTHQUAKE PREDICTION IN VIỆT NAM
It
is nowadays generally accepted that the lithosphere behaves as a non-linear
system, due to a large number of different processes, which take part in stress
redistribution at different scales, and such a complex nature of the seismic
phenomenon does not allow for deterministic predictions. The most promising
approach seems currently represented by the intermediate-term middle-range
earthquake prediction, based on certain variations of the background seismicity
preceding large earthquakes. Several possible scenarios of precursory seismic
activity have been proposed. Nevertheless, only a few formally defined
algorithms allow for a systematic monitoring of seismicity, as well as for a
widespread testing of their performances. Among them there is the algorithm CN
(Keilis-Borok, 1996 and references herein), which belongs to a family of
medium-range intermediate-term earthquake prediction algorithms structured
according to a general pattern-recognition scheme and based on a quantitative
analysis of the seismic flow [6-17]. The worldwide tests of the algorithm CN,
which is applied in about twenty regions with different level of seismic
activity, show that it has the capability to predict about 80% of strong
earthquakes with alarm periods covering about 20% of the total time interval
considered (Rotwain and Novikova, 1999). The area where a strong earthquake is
expected has linear dimensions about 100-300 km. The significance level of the
obtained results (larger than 95%) substantiates the predictive capability of
such algorithm. The intermediate-term earthquake prediction can be used to
reduce casualties, economic losses and other damage inflicted by earthquakes.
The key to this reduction is the diversity of preparedness and safety measures
combined in flexible scenarios of response to a prediction.
The CN algorithm is structured according to a pattern recognition scheme to
allow the identification of the time of increased probability (TIP) of strong
earthquakes with magnitude above a fixed threshold Mo. The quantification of the seismicity
patterns is based on phenomena that are observed in many non-linear systems
before collapse (the response to a perturbation increases, becomes more
chaotic, and acts at large distances). The theoretical and numerical
aspects of earthquake prediction research have been developed in the framework
of an existing long-term and fruitful co-operation of an Italian team with
Russian colleagues of the IIEPT (International Institute of Earthquake
Prediction Theory and Mathematical Geophysics, RAS, Moscow).
1. Regionalization for
CN application
The
region for CN application in Việt Nam is defined taking into account
the seismotectonic zoning and including regions with high density of epicenters
and earthquake of large magnitude:
1. The length dimension is not less than 5L-10L,
in which L=L (M0) is the source linear dimension responsible for
earthquake with the magnitude M0 (correspoding to the formula of
Wells and Coppersmith, 1994).
2. The boundary of the areas coincides with the
zones of low seismic activity.
3. The number of earthquake versus magnitude
within the defined region, the threshold M0 for selection of events
to be predicted is fixed to be M0 = 5.5 and is not less than 3.
2. Catalogue of earthquake for
intermediate-term earthquake prediction by CN algorithm
The
Việt Nam catalogue (VNCAT catalogue) of earthquakes was compiled based on three
data sources:
- Catalogue of historical earthquakes up to
1900.
- Catalogues from macroseismic data,
investigating in public documentation (1900-1976).
- Earthquakes recorded from seismic network of
Việt Nam (since 1963).
The
Gütenberg-Richter distribution shows that the VNCAT catalogue alone cannot used
for CN application and it is necessary to make use of different data set to
compile an updated catalogue suitable for seismicity monitoring. A cross
comparision between VNCAT and the global catalogues from NEIC, NOAA and ISC is
perform. The events not reported in VNCAT are incorporated into the Vietnamese
national catalogue. The completeness of the resulting catalogue is analyzed.
Catalogues compared: - NOAA: National Oceanic and Atmospheric
Administration, USA
(460-1995);
-
NEIC: National Earthquake
Information Center,
USGS, USA (1900-2005);
-
ISC: International Seismological Centre,
UK,
(1964-2001); and
-
VNCAT: National Catalogue of Việt Nam,
IGP-VAST, Việt Nam
(1900-2005).
Region: Lat:
40 N - 240 N; Lon: 1000 E - 1180 E.
Rules for identification
of common events: - Time difference: Δt ≤ 1.0 minute;
-
Epicentral distance: ΔLa = ΔLon ≤1.0 degree; and
-
No limitation imposed on magnitude or depth difference: ΔM ≤ 9.0; ΔH ≤ 999.0 km;
The
frequency diagram of the VNCAT-NOAA-NEIC catalogue is analyzed, considering
different time interval: 1900-2003, 1900-1975, and 1975-2003. The number of
events in the integrated catalogue (ALL) appears generally larger than for the
Vietnamese catalogue only, showing an improvement of data at all magnitude,
since 1964. The completeness threshold for the catalogue VNCAT-NOAA-NEIC can be
confidently fixed at MC = 4.2 since 1974 and MC = 4.4 since
1964. The integrated catalogue, however, appears rather complete also for
magnitude M > 3.2 since 1964.
3. CN algorithm
The
CN algorithm is based on the set of empirical functions of time to allow a
quantitative analysis of the premonitory parttern which can be detected in the
seismic flow:
-
Variation in the seismic activity;
-
Seismic quiescence; and
-
Space-time clustering of events.
It
allows to identify the TIPs (Time of Increased Probability) for the occurrence
of a strong earthquake within a delimited region.
TIP
(Time of Increased Probability) is the interval of time when the probability
for the occurrence of a strong earthquake, within a delimited region, increase
with respect to the normal condition.
Normalization of the functions of seismic flow is
necessary to ensure adequate uniform application of the algorithm with the same
set of adjustable parameters in regions of different seismic activity.
We
use the normalization by minimal magnitude cutoff Mmin, defined by
one of the two conditions: - Mmin = M0 - C, C = Constant
-
Mmin such as N (Mmin) = A, A = Constant rate of activity.
|
|
|
|
|
|
|
|
|
|
|
|
|
N1
|
N3
|
K
|
G
|
Sigma
|
Smax
|
Zmax
|
q
|
Bmax
|
|
Mmin
|
m3
|
m2
|
m2
|
m2
|
m1
|
m1
|
m1
|
m2
|
-
|
|
Mmax
|
-
|
-
|
-
|
-
|
M0-1
|
M0-1
|
M0-1
|
-
|
-
|
Rates of activity: m1 (a
= 3.0); m2 (b = 1.4); m3(c = 0.4)
Aftershocks
identification: Windows method: An earthquake j
is an aftershock of the earthquake i
if: t (j) ≥ t (i); M (j) ≤ M (i):
-
t(i) - t(j) ≤ T(M(i)) Time difference;
-
r(i,j) ≤ R(M(i)) Distance betwwen
epicenters; and
-
h(i,j) ≤ H(M(i)) Depth difference.
T
(M), R (M) and H (M) are numerical functions of the magnitude M of the main
shock.
|
M
|
3.9
|
4.0 - 4.4
|
4.5 - 5.4
|
5.5 - 6.4
|
6.5
|
|
T(M)*
|
46
|
91
|
182
|
365
|
730
|
|
R(M)
|
50 km
|
(Keilis-Borok et al.,
1980)
Area: 5L - 10L (L - the source linear dimension).
Magnitude: M0 - 3 ≥ MC
Yearly everage number of events with magnitude above completeness >3:
N (M ≥ MC)
≥3.
Choose the M0: Return period for events with M ≥ M0
not lower than 6-7 years.
Regionalization based on
the seismotectonic model: It has been shown in the
Italian territory that a regionalization strickly based on the seismotectonic
zoning permit to reduce the spartual uncertainty of prediction. A general
reduction of the percentage of total TIPs has been observed as well [14-17].
In
the regionalization based on the seismotectonic model, precursors are detected
incide seismogenically homogeneous areas associated to a dominating geodynamic
process.
Characterization of seismic
sources for Việt Nam and
surrounding regions: The seismotectonic zoning
of Việt Nam
considered in this study has been defined by Cao Đình Triều et al. (2003). The
area has been divided into 30 seismogenic zones, based on geological and
seismotectonic study, gravity anomalies, magnetic anomalies, and seismic
activity.
Regionalization for CN
application in Việt Nam: The
region for CN application in Việt Nam is defined taking into account
the seismic zoning and including areas with high density of epicenters and
earthquakes of large magnitude.
According
to CN rules and taking into account the distribution of the events versus
magnitude within the defined region, the threshold M0 for selection
of events to be predicted is fixed to be M0 = 5.5.
Table 1. Main shocks of
"Extended NW Việt Nam"
with the M ≥ 5.5
(1964-2000).
|
Date
|
Latitude
|
Longitude
|
Depth
|
Magnitude
|
|
18
Dec.,1966
|
22.6
|
102.3
|
0
|
5.6
|
|
23
Jan., 1972
|
23.3
|
102.3
|
33
|
5.6
|
|
24
Jun., 1983
|
21.77
|
103.4
|
23
|
6.7
|
|
16
Jun., 1989
|
20.67
|
102.36
|
15
|
5.9
|
Table 2. Experiment with CN application for NW Việt Nam on
the basis of data set to 2000
|
Time interval
1964-2000; Threshold setting period: 1968-2000
|
|
Time
|
Learning period
|
Mc
|
n/N
|
%
TIPs
|
(N-n)/N %
|
(h +t) %
|
|
1964-2004
|
1968-2000
|
3.0
|
2/4
|
24.1
|
50
|
74.1
|
|
1964-2004
|
1968-2000
|
3.2
|
2/4
|
21.4
|
50
|
71.4
|
|
1964-2004
|
1968-2000
|
3.4
|
3/4
|
26.1
|
25
|
51.1
|
|
1964-2004
|
1968-2000
|
3.6
|
2/4
|
36.7
|
50
|
86.7
|
|
Time
interval 1974-2000; Threshold setting period: 1978-2000
|
|
1974-2000
|
1978-2000
|
3.0
|
1/2
|
211
|
50
|
71.1
|
|
1974-2000
|
1978-2000
|
3.2
|
1/2
|
24.5
|
50
|
74.5
|
|
1974-2000
|
1978-2000
|
3.4
|
2/2
|
22.5
|
0
|
22.5
|
|
1974-2000
|
1978-2000
|
3.6
|
2/2
|
30.9
|
0
|
30.9
|
First variant for experiment with CN application to predict the eathquake
in Extended NW Việt Nam:
Using the new compiled earthquake catalogue VNCAT + NEIC + NOAA, a set of
experiments is performed considering M0 = 5.5 and:
- Two different time intervals: 1964-2000;
1974-2000; and
- Four different values of the completeness
threshold: MC = 3.0, 3.2, 3.4, 3.6
The
best is obtained for the period 1974 - 2000 and for MC = 3.4 (3 out
of 4 events with M > 5.5 are
predicted. with 34.3 of alarm time).
Relatively good results are obtained with MC
= 3.4 also for the period 1964-2000.
Second variant for experiment with CN application to predicte the
eathquake in Extended NW Việt Nam
(interval time 1990-6/2006):
We
can make the following conclusions:
+ Catalogue of Earthquake from 1964 to 2000:
- 4 earthquakes: in 1966 - M5.6; in 1972 -
M5.6; in 1983 - M6.7; in 1989 - M5.9;
- The earthquake in 1966 is not recognized;
- In 1972, 1983 and 1989 earthquakes are
recognized;
- To identify 1 TIP from 2001 to 2005 (MC = 3.2
and 3.4). In 2001, one earthquake with M5.3 occurred in Điện Biên area (coordinates: 21.27 N - 101.51
E) (Fig. 7).
Table
3. Main shocks
of Extended NW Việt Nam
with the M ≥ 5.5 (1990-6/2006).
|
Date
|
Latitude
|
Longitude
|
Depth
|
Magnitude
|
|
2001.2.19
|
21.33
|
102.85
|
12
|
5.3
|
|
2003.10.3
|
21.27
|
101.51
|
33
|
6.2
|
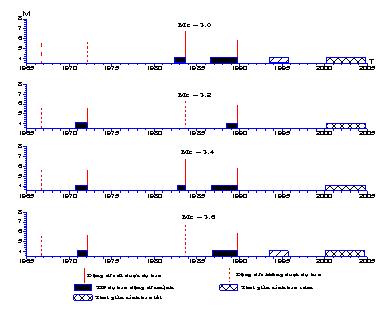
Figure
1. TIPs diagram for the best prediction result of NW Việt Nam
(interval time 1964-2000) from 2001 to 2005 with the magnitude more than 5.5
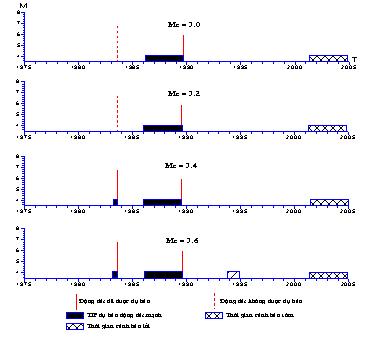
Figure
2. TIPs diagram for the best prediction result of NW Việt Nam
(interval time 1974-2000) from 2001 to 2005 with the magnitude more than 5.5
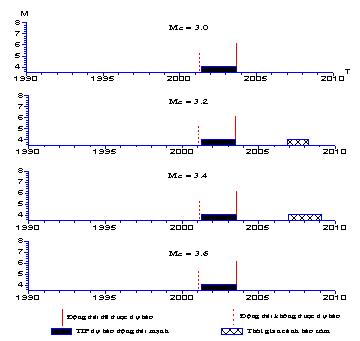
Figure
3. TIPs diagram for the best prediction result of NW Việt Nam
(interval time 1990 - 6/2006) from 2007
to 2012 with the magnitude more than 5.5
+ Catalogue of Earthquake from 1974 to 2000:
- 2 earthquakes: in 1983
- M6.7; in 1989 - M5.9
- In 1983 and 1989 they
are recognized;
- To identify 1 TIP from
2001 to 2005 (MC = 3.2 and 3.4). In 2001 one earthquake with M5.3 occurred in
Điện Biên area (coordinates:
21.27 N - 101.51 E) (Fig. 2).
+ Catalogue of Earthquake from 1990 to 2006:
1 earthquake: in 2001 -
M5.3
- In 2001 it is
recognized;
- To identify 1 TIP from
2007 to 2012 (Mc=3.2 and 3.4) (Fig. 3).
III. APPLICATION OF THE M8-M8S ALGORITHMS FOR INTERMEDIATE-TERM EARTHQUAKE PREDICTION IN
VIỆT NAM
The M8 algorithm is
applied on the global scale for the prediction of strongest events:
Magnitude ≥ 8.0 Area: 667 km radius
Magnitude ≥ 7.5 Area: 427 km radius
The M8 algorithm uses
traditional description of a dynamical system adding to a common phase space of
rate (N) and rate differential (L) dimenssionless concentration (Z) and a
characteristic measure of clustering (B)
to determine middle range predictions.
The MSc algorithm reduces
the area of alarm outlining, such an area where the activity, from the
beginning of seismic inverse cascade recognized by M8, is continuously high and
infrequently drops for a short time. The phenomenon might reflect the
narrow-range intermittence of the seismic premonitory rise near the incipient
source of main shock [7-13].
The quality of prediction
can be defined by using two prediction parameters:
- N0 = n/N is
the rate of failure-to-predict; and
- T0 = t/T is
the rate of alarm time (Molchan, 1997).
N is the number of strong
earthquake occurred during the time period T covered by prediction. The alarm
cover altogether the time t and they have missed n strong events.
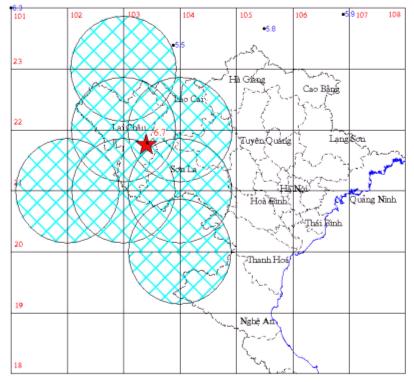
Figure 4. Recognization result of the
application M8S algorithm for Tuần Giáo M6.7 earthquake (24 June, 1983).
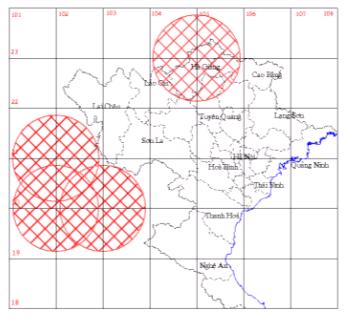
Figure 5. The red colour of the circles is the areas
having danger with the occurrence of the earthquakes M6.5+ from 2006 to 2010.
Seismic
activity in Việt Nam
is not activated and characterized by:
-
The epicenter distribution is not widespread, mainly concentrated in the areas
of Extended NW Việt Nam;
-
Cumulative number of events is not great, smaller than 10, and mainly is from 3
to 6.
-
The largest earthquakes occurred in this region have the magnitude not
exceeding M7.0.
In
this case, the M8S is effectively used for earthquake prediction (M6.5+, R =
192 km).
1.
The Tuần Giáo M6.7 earthquake (14 June, 1983) is recognized by M8S with the
radius R equal 192 km and the interval time of the catalogue is from 1964 to
1980. The grid board is 10 × 10, and magnitude threshold
M6.5+ (Fig. 4).
2.
Using M8S algorithm for prediction the areas to be danger with the
magnitude M6.5+ in the North Việt Nam after 2005 year. Two areas are
predicted to have danger with the occurrence of the earthquakes M6.5+ from 2006
to 2010 by M8S with the radius R equal to 192 km and the interval time of the
catalogue is from 1974 to 2005. The grid board is 10 × 10,
and M6.5+ (Fig. 5).
IV. CONCLUSIONS
The
CN and M8S algorithms have been successfully applied in the Vietnamese
territory for intermediate-term earthquake prediction. On the basis of the
above obtained results, the following conclusions can be made:
1. Three from four events were recognized by CN
algorithm with the catalogue from 1964 to 2000 and one TIP was made in 2001
with the duration 5 years. This event (M6.2) occurred on October 3rd,
2003 (coordinates: 21.27 N - 101.51 E).
2. One TIP with magnitude more than 5.5 can be
made from 2006 in Extended NW Việt Nam with the catalogue from 1964 to 2005,
using CN algorithm.
3.
Extended M8-M8S algorithm is the one that can effectively be used for
earthquake prediction in Việt Nam:
Tuần Giáo M6.7 (24/6/1983)
predicted on the basis of earthquake events to the end of 1980, with the
duration of TIP's from 1981 to 1986.
4.
During the time from 2006 to 2010, the danger of having earthquake M6.5+ occurs
in the regions of NW Lao and N Hà Giang province, using M8S algorithm.
The
authors would like to express special thanks to the Italian Ministry of Foreign
Affairs, Italian Embassy in Hà Nội, SAND of ICTP, DST of University of Trieste,
Việt Nam Ministry of Foreign Affairs, MOST, VAST and IGP of VAST for the help
and facilities provided in the process of the project implementation.
REFERENCES
1. Cao Đình Triều, Nguyễn Thanh Xuân, 1996.
Probability approach for long-term earthquake Ms>6.5 prediction in Tây Bắc
region based on the regulation of epicentral distribution. J. of Geology, A/238 : 33-38. Hà Nội.
2. Cao
Đình Triều, 1999. Probable approach for long-term earthquakes
prediction in Việt Nam
based on regulation of epicentral distribution. J. of Geology, A/251 : 14-21. Hà Nội.
3. Cao
Đình Triều, G.F. Panza, A. Peresan, F. Vaccari, F. Romanelli, Nguyễn Hữu Tuyên,
Phạm Nam
Hưng, Lê Văn Dũng, Mai Xuân Bách, 2004. An overview of seismic activity of Việt Nam territory and surrounding
areas. Intern. Conf. on Nat. Evir., Sust.
Prot. and Cons.: Italy - Việt
Nam
Coop. Persp..
4. Đặng Thanh Hải, Nguyễn
Đức Vinh, Cao Đình Triều, 2002. Long-term earthquake prediction
in Lai Châu - Điện Biên area on the basis of time-magnitude model. Vietnamese
J. of Sci. and Techn., 40/4 : 45-53. Hà Nội.
5. Gabrielov A.M., Dmitrieva O.E., Keilis-Borok
V.I., Kossobokov V.G., Kouznetsov I.V., Levshina T.A., Mirzoev K.M., Molchan
G.M., Negmatullaev S.Kh., Pisarenko V.F., Prozoroff A.G., Renehart W., Rotwain
I.M., Shebalin P.N., Shnirman M.G., Schreider S.Yu., 1986.
Algorithms of long-term earthquake prediction. CERESIS, Lima, Peru, pp.61.
6.
Keilis-Borok V.I., Kossobokov V.G., 1988. Premonitory activation of
seismic flow: Algorithm M8. Notes of the Worksh. on Glob. Geoph. Inf. with
Appl. to Res. in Earthquake Pred. and
Red. of Seismic Risk, ICTP, Trieste,
pp.17.
7.
Keilis-Borok V.I., Kossobokov V.G., 1990. Premonitory activation of
seismic flow: Algorithm M8. Phys. Earth
and Planet. Inter., 61 : 73-83.
8.
Keilis-Borok V.I., Kossobokov V.G., 1990. Times of Increased Probability
of Strong Earthquakes (M o 7.5) Diagnosed by Algorithm M8 in Japan and Adjacent Territories, J. Geophys.Res., 95, No. B8, 12413-12422.
9.
Keilis-Borok V.I., Soloviev A.A. (Ed.), 2003.
Nonlinear dynamics of the lithosphere and earthquake prediction. Springer, Heidelberg.
10.
Kossobokov V.G., Healy J.H., Keilis-Borok V.I., Lee W.H.K., 1997.
Algorithm for earthquake statistics and prediction. IASPEI Softw. Libr., 6. Seism. Soc. Am., El Cerrito, CA.
11.
Kossobokov V.G., Healy J.H., Dewey J.W., 1997. Testing an earthquake
prediction algorithm. Pure Appl.
Geophys., 149 : 219-232.
12.
Kossobokov V.G., Romashkova L.L., Panza G.F., Perecan A., 2002.
Stabilizing intermediate-term medium-range earthquake prediction. J. Seism. Earthqu. Eng., 4/2-3 : 11-19.
13. Nguyễn Đình Xuyên, Phạm Đình
Nguyên, Phạm Quang Hưng, Nguyễn Ánh Dương, 2003.
Long-term earthquake prediction on the basis of the foreshocks rule. J. of Sci. of the Earth, 25/3 : 193-200. Hà
Nội.
14. Peresan A., Rotwain I.M.,
1998. Analysis and definition of magnitude selection criteria for NEIC (PDE)
data, oriented to the compilation of a homogenous up dated for CN monitoring in Italy. The Abdus Salam Intern. Centre for Theor. Phys., ICTP. Internal report.
Trieste. Italy.
IC/98/97.
15. A. Peresan, G.F.Panza, G.
Costa, 1999. Seimototectonic
model and CN earthquake prediction in Italy. Pure and Applied Geophysics, 281-306.
16. A. Peresan, G.F.Panza, G.
Costa, 2000. CN
algorithm and long-lasting changes in reported magnitudes: The case of Italy.
Geophysics J. Int., pp. 425-437.