I. INTRODUCTION
The effects of magnetic storm on the ionosphere are
complex and deviate greatly from average behaviour. There are some common
elements of behaviour for most storms, but it has been recognized that in the
low latitude regions the ionospheric response to particular geomagnetic storms manifests some irregularities.
The studies of magnetic storm effects on the
ionosphere usually concentrate on the deviation of the F-layer parameters during
storm periods from monthly averages [13]. Effects of electromagnetic drift can
be studied by changes in the height of the F-layer [14]. Danilov and Morozova
[4] suggested the characteristics of ionospheric storms should be studied in
terms of deviations of the F-layer critical frequency foF2 for positive and
negative phases from the median value and changes in the minimum virtual height
h’F and the peak height hpF2.
Many reports show details
of the variation of electron density at the F2-layer peak or foF2, h’F and hpF
variations. These variations are involved with enhancement or reduction during
the positive and negative storm phases. A study of the disturbed ionosphere in
the Australasian and American zones during IGY-IGC was done by G. Rajaram and R.G.
Rastogi (1970). Adeniyi [1] reported magnetic storm effect on the F2-layer at Ibadan (7.4° N, 3.9° E,
mag. dip 6º S) for solar cycle period 1956-1966. The ionospheric effects in East Asia of the large magnetic storm of 13-15 March 1989
have been investigated by [6, 15]. Ionospheric disturbances around East Asia
region during the 20 October, 1989 magnetic storm were reported by [7, 16],
reporting ionospheric responses at Kodaikanal (10.6° N, 75° E, geomag. lat.
0.6° N). Bust [3] reported the ionospheric observations of the November 1993
storm, and
global ionospheric TEC variations during January 10, 1997 storm have been reported by
[5]. Sahai [9] reported for the occurrence of large scale equatorial F-region
plasma depletions, and the response of the equatorial ionsphere in the South Atlantic region to the great magnetic storm of July 15, 2000 has been
investigated by [2]. Response of the equatorial ionsphere in the Indian sector
to the same magnetic storm has been investigated by [11]. Also, Lee [8] reported
for the large density depletions in the nighttime upper ionosphere during this
magnetic storm. Sahai et al. [10] reported the effects observed in the F-region
in two longitudinal sectors during the major geomagnetic storm in October 2003.
Many studies have focused on the ionosphere at
middle and high latitudes. However, our understanding of the ionospheric storms
at the equatorial area seems unsatisfactory. Also, it is important to
investigate the worldwide effects, in detail, of individual geomagnetic storms
in order to determine the overall predominant physical mechanisms taking place
in the ionosphere during geomagnetic storms.
Hồ Chí Minh City
is located in the equatorial region
(10.51° N, 106.34° E, dip. lat. 2.9° N) and therefore the ionospheric data registered
at Hồ Chí Minh City Geophysical Observatory (HCM) may be effectively used in
the study of features in the equatorial ionospheric response to geomagnetic
storms. In this paper we present some features of the ionospheric response to
three strong geomagnetic storms that were observed during the 2003 year.
II. DATA ANALYSIS AND RESULTS
The study is based on the ionosonde data collected
during three major geomagnetic storms in 2003: 17-18 August, 29-30 October and
20 November. The analysis of the ionospheric data is restricted to the critical
frequency of F- region (foF2) and the
minimum virtual height (h’F). The ionograms recorded every 15 minutes at HCM
Observatory were scaled to obtain foF2 and h’F parameters. For comparison
purposes, the monthly average values will be presented. The magnetic
H-component values obtained at HCM Observatory were used for this analysis. The
maximum negative excursions of the H-component observed for these storms varied
between 217 and 512 nT. The Dst was
downloaded from the website: http://swdcdb.kugi.kyoto-u.ac.jp/wdc
The periods selected for the present study related
to storm effects are: 17-19 August, 2003; 29-31 October, 2003; 19-21 November,
2003.
The local
time LT = UT + 7 hours and hence local nighttime is 11:00 – 23:00 UT.
1. Storm of
17-18 August, 2003
This storm occurred with a SC at 14:21 UT (21:21 LT) on 17 August, 2003. The local H-component variation during
this storm showed maximum decrease of 217
nT at 13:42 UT on 18
August. The maximum negative excursion of Dst was 168 nT at 16:00 UT on 18 August, 2003.
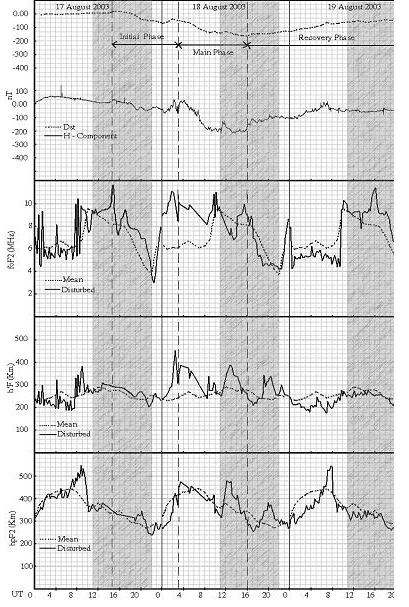
Fig. 1 shows the Dst variations along with the
H-component, foF2 and h’F observed at HCMC observatory during 17-19 August.
The initial stage was from 14:21 UT on 17 August to 04 UT on 18 August.
The main stage was from 04 UT to 17 UT on 18 August. The data showed that in
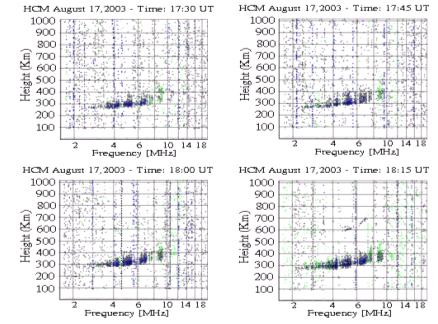
the initial phase, from 13:30 UT to 18:30
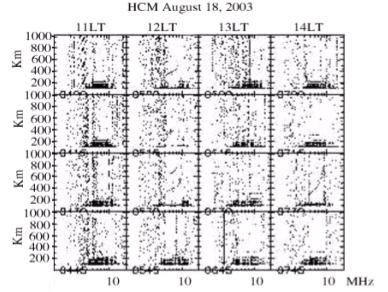
UT we observed spread F (Fig. 2) and in the main phase, during
period 03 – 12 UT on 18 August we observed sporadic E (Fig. 3). At the SC a
short-lived increase in foF2 is observed. The critical frequency was 11.6 MHz,
higher than the mean value for this month,
8.6 MHz (the critical frequency for quiet condition was 8.5 MHz).
The most striking feature is the increase of
maximum F-region ionization levels in the daytime of this storm period. On 18
August the increase was more than 3 MHz above average, and on 19 August there
was also an increase of about 1 MHz. There was a fall in the foF2 values during
the interval 12 UT - 14 UT, 18 August, which corresponds to the period of
maximum decrease of the magnetic field. Accompanying this decrease of foF2 is
an increase of the h’F. The value of the h’F at 13 UT was raised about 70 km
compared with the mean value.
An increase with about 80 km in h’F during
post-midnight period 19-20 UT (02-03 LT), August 18, corresponding to the early
part of the recovery phase was observed.
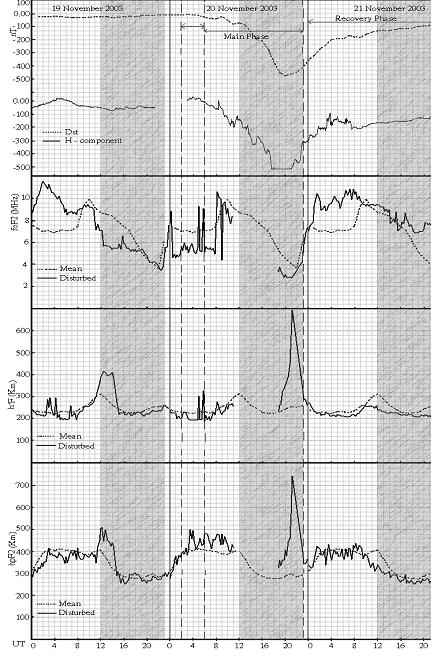
Fig. 5 shows the Dst variations along with the
H-component, foF2 and h’F observed during 19-21 November. During 02:45 - 03:45 UT on 19 November we
observed sporadic E, and during the period 12-16 UT, 19 November we observed
spread F. There were no immediate effects on F-region ionization following the
storm commencement. The critical frequencies increased sharply at the end of
the initial phase. There is a data gap from sunset to midnight (~12 - 17 UT) on 20 November, but
later during post-midnight, at about 20 UT, when the H-component reached
maximum depression there was a decrease of
foF2 by ~1 MHz compared to the monthly average.
The h’F showed a large uplifting (h’F went from 350
km at 20 UT to 860 km at 21:30 UT,
20 November). This occurred at the end of the main phase of the storm.
The main conclusions drawn from our study are as
follows:
1. The foF2 values are enhanced during daytime
(mostly) of magnetic storm periods.
2. During post-midnight periods, the base F region
height (h’F) variations show a occasional rapid and large uplifting during the
maximum depression of the Earth’s magnetic horizontal component H. The
uplifting corresponds to a simultaneous decrease in foF2.
3. While on most of the quiet nights, close to
midnight or post-midnight periods observed spread F formating from west and
drifting eastward, during the magnetic storm periods only two disturbed nights
was observed spread F.
III. DISCUSSIONS
A comparison with the previous results is directed
to observations at stations located around magnetic equator. According Adeniyi
[1], the magnetic storm effect on the F2-layer at Ibadan (7.4° N, 3.9° E, mag. dip 6º S) for a
solar cycle period 1956-1966 was observed with daytime decreases in NmF2 during
the initial phases. In the main phases and early part of the recovery phases,
they observed increases or no significant changes of the NmF2 in the morning (05:00 - 09:00 LT). In the daytime (09:00 - 18:00 LT) and nighttime (18:00 - 08:00 LT) they observed
increases. This effect occurred during both of the period of high and low solar
activity. Lakshmi et al [7] made a detail analysis based on the ionosphere data
observed at Kodaikanal (10.14° N, 77.29° E, mag. dip. .5º N) during a large
number of severe storms. They reported that during pre-midnight periods
increases in foF2 are found associated with decreases in the h’F. During
post-midnight periods, decreases in foF2 are associated with increases in h’F. Several features were observed but the
major feature was a sudden collapse of
F-layer ionization in the post-midnight period.
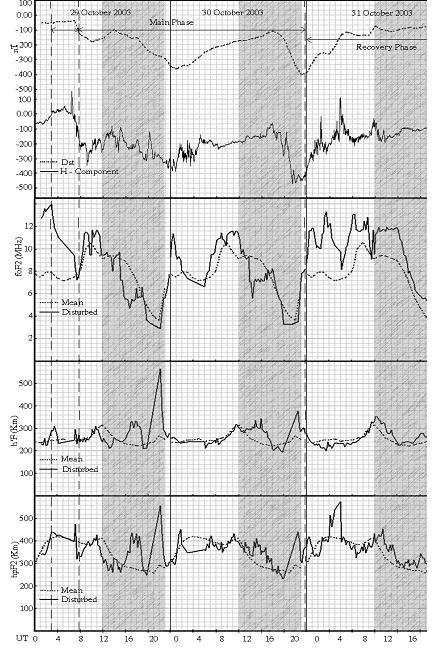
In one another paper (2004) we studied effects of the storms in October 2003
observed in Palmas (PAL) and São José dos Campos (SJC), Brazil (Brazilian
sector), and Hồ Chí Minh City (HCMC), Việt Nam and Okinawa (OKI), Japan (East
Asian sector). The two sectors are separated by about 11 hours in local time
(if one sector is in daytime, the other one is in nighttime and vice versa). It
appears that the response of the F-region during the geomagnetic storms was
very different in the equatorial and low latitude regions in the two
longitudinal sectors. In the East-Asian sector the prominent feature observed
was the presence of wave-like disturbances at HCM and OKI in both F-region
heights and peak electron densities. This feature appeared soon after the SSC
on 29 October at 06:11 UT
and continued till the dusk time on 31 October. OKI showed unusual foF2
enhancement on the night of 31 October-01 November, during the recovery phase. In Brazil
sector, soon after the SSC on 29 October at 06:11 UT, both PAL and SJC showed simultaneous uplifting
of the F-region and was followed by wave-like disturbances in both the F-region heights and peak electron
densities during the daytime. Around the dusk time on 29 October large-scale
TIDs were detected at both the locations. Again after the SSC on 30 October
both PAL and SJC showed simultaneous uplifting of the F-region. During the
recovery phase on 31 October, SJC showed the presence of negative phase in the
foF2 variations during the daytime. Both the nights 29-30 and 30-31 October had
spread-F at both the locations. However, in the East Asian sector, HCM showed
the presence of spread F on most of the quiet nights, but no spread F was observed on the disturbed
nights and OKI showed the presence of
spread F only on 31 October night.
The most obvious features are the increase in foF2
during daytime and the large increase in h’F in early morning hours. The
occurrence of this increase in h’F is coincident with a fall in foF2. The
diurnal variation of the Earth’s magnetic field is known to indicate variation
of the E-region current in the equatorial region, and hence show the presence
of significant electric fields. Changes in the equatorial ionospheric electric
field should normally play a major role in storm effects on electron density of
the F-region since even the normal E × B force has a great influence on quiet
day variation of the F-layer as shown by the Appleton anomaly. It is well known that many
features of the equatorial F-region can be explained in terms of movement of
ionization caused by the cross field of the electric and magnetic fields. The east-west
electric field in conjunction with the Earth’s north south magnetic field
lines, which are horizontal around the equator, causes a force to act on
ionization in the vertical direction. The direction of the electric field in
the equatorial region is normally eastward during daytime and westward during
nighttime. At night, zonal westward electric fields produce a downward E × B
drift. The decrease in H-component during storm periods indicates a reduction
in the eastward electric field during the daytime. The reduced eastward field
means that the equatorial ionization ‘fountain’ is reduced in strength and this
results in higher daytime F region densities. During nighttime there appear to
be large variations in the zonal electric field and these result in significant
variations of height, and of foF2.
A major effect that is seen for all 3 storms is the
notable increase of h’F just before dawn. During night time h’F is normally
falling due to a westward electric field. There could be due to an effect of the
ring current in the post-midnight period that may create momentarily an
eastward polarization electric field and greatly raise the height of the layer
for a short period just pre-dawn. From the present results it follows that the
pre-dawn rise in h’F is an indication of changing of electric field direction
from westward to eastward. This effect in turn, provokes an upward E x B drift
and causes a loss of plasma from the equatorial region, by the equatorial
fountain effect, as indicated by associated decrease in the foF2 values.
In the
recent past, studies related to magnetosphere – ionosphere interactions during
geomagnetic storms at equatorial latitudes, which are extreme forms of space
weather have been the subject of both observational and modeling investigations.
It is felt that more simultaneous studies using ionospheric sounding
observations from several longitudinal zones will be important for space
weather studies.
Acknowledgements: This work is supported
by the Basic Research Program through Project of code
7.002.06.
REFERENCES
1. Adeniyi J.O., 1986.
Magnetic storm effects on the morphology of the equatorial F2-layer. J. of Atmosph.
and Terr. Physics, 48/8: 695-702.
2. Basu S., Groves K. M., Yeh H.
C., Su S., Rich F.J., Sultan P.J., Keskinen M.J., 2001.
Response of the equatorial ionosphere in the South
Atlantic region to the great magnetic storm of July 15, 2000. Geoph.
Res. Lett., 28: 3577-3580.
3. Bust A.G., Guassiran T.L., Coco D.S., 1997. Ionospheric observations of
the November 1993 storm. J. of Geoph. Res., 102: 14293-14304.
4. Danilov A.D., Morozova L.D.,
1985. Ionospheric storm in the F2 region: Morphology and physics (Review). Geomagnetism
and Aeronomy, 25 : 593-605.
5. Ho C., Mannucci M.,
Lindqwister U.J., Tsurutani B.T., Sparks L., Iijima B.A., Wilson B.D., Harris I., Reyes M.J., 1998. Global ionospheric TEC
variations during January 10, 1997 storm. Geoph. Res. Lett., 25: 2589-2592.
6. Lakshmi D. R., Rao C.N., Jain
A.R., Goel M.K., Reddy B.M., 1991. Response of equatorial and
low-latitude F-region to the great magnetic storm of 13 March, 1989. Ann.
Geoph., 9: 286-290.
7. Lakshmi D.R., Veenadhari B.,
Dabas R.S., Reddy B.M., 1997. Sudden post-midnight decrease
in equatorial F-region electron densities associated with severe magnetic
storms. Ann. Geoph., 15: 306-313.
8. Lee J.J., Min K.W., Kim V.P.,
Hegai V.V., Oyama K.I., Rich F.J., Kim J., 2002. Large
density depletions in the nighttime upper ionosphere during the magnetic storm
of July 15, 2000. Geoph. Res. Lett., 29: 10. 1029/2001GL013991.
9. Sahai Y., Fagundes P.R.,
Bittencourt J.A., Abdu M.A., 1998. Occurrence of large-scale
equatorial F-region plasma depletions during geo-magnetic storm. J. of Atm.
and Solar-Terr. Physics, 60: 1593-1604.
10. Sahai Y., H.T. Lan, J.W.
MacDougall, P.R. Fagundes, F. Becker-Guedes, M.J.A. Bolzan, J.R. Abalde, V.G.
Pillat, R. de Jesus, A.G.R. Mokod, W.L.C. Lima, K. Igarashi, K. Shiokawa, G.
Crowley, J.A. Bittencourt, 2004. Effects of the major geomagnetic storms in October 2003 on the equatorial
and low latitude F-region in two longitudinal sectors. J. of Geoph. Res.,
110: 10. 1029/2004JA010999.
11. Sastri J.H., Niranjan K., Subbarao K.S., 2002. Response of the equatorial ionosphere in the
Indian (midnight) sector to the severe magnetic storm of July 15, 2000. Geoph.
Res. Lett., 29: 10. 1029/2002GL015133.
12. Titheridge J.E., 1985. Report
UGA-93.
13. Turunen T., Rao M., 1980.
Examples of the influence of strong magnetic storms on the equatorial F-layer. J.
of Atm. and Terr. Physics, 42: 323-330.
14. van Zandt T.E., Peterson
V.L., Laird A.R., 1971. Electromagnetic drift of the midlatitude F2
layer during a storm. J. of Geoph. Res., 76: 278-281.
15. Walker G.O., Wong Y.W., 1993.
Ionospheric effects observed throughout East Asia
of the large magnetic storm of 13-15 March, 1989. J. of Atm. and Terr.
Physics, 55/7: 985-1008.
16. Yin-Nien Huang, Kang Cheng,
1993. Ionospheric disturbances around East Asia
region during the 20 October, 1989 magnetic storm. J. of Atm. and Terr.
Physics, 55/7: 1009-1020