COMBINATION OF RAMAN-RAYLEIGH LIDAR FOR HUMIDITY AND TEMPERATURE
MEASUREMENT OVER CHUNGLI, TAIWAN
1,2CHIH-WEI CHIANG, 2SUBRATA
KUMAR DAS, 2JAN-BAI NEE
1Research Center
for Environmental Changes, Academia Sinica, Nankang,
Taiwan;
2Department of Physics, National
Central University,
Chungli, Taiwan
Abstract: The
combined Raman-Rayleigh
lidar system has been designed for the measurement of various atmospheric
parameters at Chungli, Taiwan. This paper presents the detailed methodology for
retrieving water mixing ratio, temperature and extinction-to-backscatter ratio
of aerosols from Raman-Rayleigh backscattering signals in the lower atmosphere.
Two case studies; one with dry condition and the other with humid condition
were also discussed to demonstrate the effects of humidity on aerosols
swelling.
I. INTRODUCTION
The vertical distribution
of water-vapour mixing ratio (WMR) and temperature can be obtained through
in-situ measurements with radiosonde. The radiosonde observations are important
for remote sensing application, but the disadvantage of it is the limited
horizontal and temporal resolutions, which are related to the geographical
distribution of the meteorological stations and the launching frequency. There
are many passive remote sensing sensors, however most of them have poor
vertical resolution or yield only column integrated quantities. Such sensors
can be ground or satellite based. Satellite measurements have overcome the
limitation in horizontal resolution, but they are still limited in temporal
resolution. In order to obtain vertical profiles of water vapour and temperature
with good temporal and spatial resolution at a desired site and at variable
time, it is needed to develop separate techniques for its retrieval. The use of
the active sensors such as lidar has overcome the shortcoming mention above and
can measure atmospheric water vapour and temperature profiles with high
temporal and vertical resolutions in the order of minutes and tens of metres,
respectively. The early work demonstrated the technique of Raman spectroscopy
in the measurement of tropospheric water vapour [4,9] and temperature [6, 8].
In this paper, the
detailed procedures of a nighttime operating Raman-Rayleigh lidar system for
the measurement of high vertical resolution profiles of the WMR, temperature
and extinction-to-backscatter ratios in the lower troposphere is reported. The
lidar-derived WMR and temperature profiles are compared with profiles measured
by radiosonde and the correlation between the WMR, temperature and lidar ratio
are also discussed.
II. SYSTEM
DESCRIPTION
1. Raman-Rayleigh lidar
system
The lidar site is
located at National Central University, Chungli (24.58 N; 121.10 E, altitude
167 m, MSL), Taiwan. The lidar system consists of transmitter as an Nd: YAG
laser operating at 355 nm and a Newtonian telescope, as a receiver with a
diameter 45 cm. The lidar system is pointed vertically and operated at night
time. The signals are measured by photomultipliers and recorded continuously by
two multi-channel analyzers (MCA). The MCA will
receive the signals in accordance with the accumulative time and then assemble
in the corresponding channel. The range of backscatter signals can be
accurately determined with a vertical and temporal resolution of 24 m and 33
seconds, respectively. The signal eventually transferred into personal computer
automatically.
2. Lidar equation
The optical power
measured by lidar is proportional to the signal backscattered by particles and
molecules present in the atmosphere. The lidar signal can be expressed as Eq.
(1).
 (1)
(1)
where PM
and PL are the power received from distance Z and
laser output energy, respectively; AT is a constant which accounts for the system
optical efficiency, the telescope receiver area, and the photomultiplier tube
(PMT) spectral efficiency; βatm and τatm are backscatter coefficient and extinction by
atmospheric gases (βatm
(z) and τatm (z)) and aerosol particle (βa(z)
and τa(z)) for laser wavelength respectively.
III. DATA ANALYSIS
Raman lidar measures a
scatter radiation, which is shifted in wavelength relative to the excited laser
wavelength. When excited at the wavelength 355 nm, there will be Raman shift for nitrogen and
water vapour at 387 nm
and 407 nm,
respectively. The vertical profiles of lidar ratio, WMR and temperature are
then computed by using the signals retrieved from Raman-Rayleigh lidar.
1. Aerosol
extinction-to-backscatter ratio
The basic lidar equation
for the inelastic-backscatter signal can be written as Eq. (2):
 (2)
(2)
 (3)
(3)
where
 and
and  are the volume extinction coefficient for gas and aerosol
particle, respectively.
are the volume extinction coefficient for gas and aerosol
particle, respectively.
The particle extinction
coefficient can be obtained from Ansmann et al. (1990) by means of Eq. (2)
which is shown in the following:
 (4)
(4)
where
particle extinction is assumed to be proportional to ,
,  is constant which depends upon the size and composition of
the particles. In this study, the value κ is taken as 1.
is constant which depends upon the size and composition of
the particles. In this study, the value κ is taken as 1.
From two lidar equations
Eq. (1) and Eq. (2), a solution for the particle backscatter coefficient  can be obtained and is shown in Eq. (5).
 (5)
(5)
The
vertical profile of the lidar ratio can be obtained by using Eqs. (4) and (5)
as,
 (6)
(6)
2. Water-vapour
mixing ratio (WMR)
The WMR is considered as
the ratio of mass of water vapour to the mass of dry air in a given volume.
With respect to height, Whiteman et al. [13] expressed WMR as Eq. (7).
 (7)
(7)
Where  and
and  are the system calibration constant and the transmission
correction function for the WMR measurement respectively.
are the system calibration constant and the transmission
correction function for the WMR measurement respectively.  and
and  are the backscatter Raman signals of water vapour and
nitrogen respectively from the atmosphere.
are the backscatter Raman signals of water vapour and
nitrogen respectively from the atmosphere.
Therefore, WMR ( ) can be calculated by knowing the parameter , and utilizing the ratio of water vapour to nitrogen Raman
backscatter signal (
) can be calculated by knowing the parameter , and utilizing the ratio of water vapour to nitrogen Raman
backscatter signal ( ) measured by lidar.
a. The transmission correction function
The respective
extinction coefficient for the Raman shifted wavelength for water vapour and
nitrogen signal is the sum of extinction coefficients, scattered by air
molecules and aerosols. For air molecules, the atmospheric transmissions differ
primarily as  dependence, due to Rayleigh scattering. And in case of
aerosols, an additional correction is needed and this term can be derived by
using the extinction coefficient profile derived from Eq. (4). This will
provide the aerosols correction for the differential atmospheric transmission.
dependence, due to Rayleigh scattering. And in case of
aerosols, an additional correction is needed and this term can be derived by
using the extinction coefficient profile derived from Eq. (4). This will
provide the aerosols correction for the differential atmospheric transmission.
b. The system calibration constant Cw
The system calibration
constant can be retrieved by using relative humidity (RH). In this paper, the
RH data has been considered from radiosonde measurement. From Saucier et al.
(1989), the saturation vapour pressure can be shown as Eq. (8).
 (8)
(8)
where  is saturation vapour pressure (hPa); a = 7.5 ; b = 237.3 ;
  is 6.11 hPa (saturation vapour pressure at 0oC); t
is temperature (oC).
is 6.11 hPa (saturation vapour pressure at 0oC); t
is temperature (oC).
The saturation vapour
pressure can retrieve the saturation WMR [5], which can be written as
Eq. (9).
 (9)
(9)
where Ws(z) the saturation water mixing ratio (g/kg) is, P(z) is the pressure at height z.
The three parameters viz
RH, saturation WMR, and WMR are related with a parametric equation represented
as Eq. (10).
 (10)
(10)
where the symbols have
the usual meaning cited above. Thus, the WMR can be derived from radiosonde
based on Eqs. (9) and (10). Finally in order to estimate the system calibration
constant Cw, we converge the measured profiles of WMR from lidar (by
using Eq. (7)) to that obtained from radiosonde data at the reference point.
3. Temperature
algorithm
The retrieval of
vertical profiles of atmospheric temperature is based on the assumption of the hydrostatic
equilibrium and the ideal gas law [7]. Given a reference temperature T(zref)
and an atmospheric transmission, the atmospheric temperature (T) can be
expressed as follows:
 (11)
(11)
where M is the
atmospheric molecular weight; R is the molar gas constant; g is the
acceleration due to gravity;  is the concentration (number density) of air molecules and
aerosol.
is the concentration (number density) of air molecules and
aerosol.
Since lidar backscatter
signals are proportional to , the lidar equation (Eq. (1)) can be rewritten as:
 (12)
(12)
where AT is
constant.
Thus the Eq.(11) can be
rewritten as Eq. (13):
 (13)
(13)
However, in the lower
troposphere the aerosols are dominating factor and its effect cant be neglected
especially for the height below 5 km over the study site [3]. Thus to obtain
accurate vertical profiles of atmospheric temperature in the lower troposphere,
the iterative method employed by Chen et al. [2], needs the correction and must
be modified by considering the corrected backscatter signals for the aerosol as
well as molecular transmission, shown as Eq. (14):
 (14)
(14)
where the definition of
symbols is same with above mention, the aerosol transmission can be derived
from Eq. (4) while the molecular transmission can de calculated by using Eq. (15)
.
 (15)
(15)
where
 is the molecular Rayleigh backscattering cross section.
The iterative method used by Chen et al., [2] for retrieving the
atmospheric transmission ( ) consists of three steps. In the first step, we consider the
ideal atmosphere by setting the atmospheric transmission factor as 1 for all
heights bins. The second step is to calculate the atmospheric concentration () by considering the step one and making the use of Eq. (12).
In the third and final step, atmospheric concentration is used to calculate a
new atmospheric transmission by considering Eq. (14) and (15). The steps two
and three are repeated until both atmospheric concentration and atmospheric
transmission profiles converge respectively.
) consists of three steps. In the first step, we consider the
ideal atmosphere by setting the atmospheric transmission factor as 1 for all
heights bins. The second step is to calculate the atmospheric concentration () by considering the step one and making the use of Eq. (12).
In the third and final step, atmospheric concentration is used to calculate a
new atmospheric transmission by considering Eq. (14) and (15). The steps two
and three are repeated until both atmospheric concentration and atmospheric
transmission profiles converge respectively.
IV. MEASUREMENT AND
RESULTS
1. Comparison with
radiosonde measurements
In this paper, to
demonstrate the methodology described in section 3 we have considered two cases
for study: one when dry condition (RH<60 %) was dominant and other when
humid condition (RH>60 %) was dominant. Both the cases have been studied for
lower troposphere below 4 km. The measurements were carried on Dec. 24, 2003
(dry condition) and May 12, 2004 (humid condition) without substantial change
of the meteorological condition. Fig. 1a shows the comparison of Raman
lidar-derived (solid line) and radiosonde-derived WMR (circled symbol) while
Fig. 1b shows the comparison between temperatures measured from lidar (solid
line) and radiosonde (circled symbol) for Dec. 24, 2003. The horizontal bars
represent the standard deviation from the mean value during the observation
period. Fig. 2a and 2b is same as Fig. 1a and 1b but shown when humid condition
was dominant and the measurement was made on May 12, 2004. The value of RH is
also shown in Fig.1a and Fig.2a for reference to know about the dry and wet
condition of the environment.
In both the cases, the
comparison shows a good agreement between the WMR derived from lidar and
radiosonde in the wet condition, however in the dry condition some difference
has been found. In Fig. 1a, the difference for WMR measurements occurred at
higher height (> ~2.2 km) which is mainly related to less water vapour
content, and can cause the uncertainties in both lidar and radiosonde
measurement. This effect is more deliberate when the RH value decreases more
and the atmosphere becomes drier. However, when the RH >60%, a fairly good
correlation has been found between both the measurement of WMR but at ~1km WMR
derived from lidar deviates from radiosonde measurement which can be due to the
measurement error of radiosonde at very lower altitude. Similarly also for Fig.
2a, good correlation is found among both the measurement of WMR when RH> 60%
i.e. wet condition. But discrepancy appears under the drier condition.
The temperature profiles
derived from lidar and radiosonde shows an excellent correlation in the both
the cases. The measurement errors are within the range of ~1K. The discrepancy
between the lidar and radiosonde measurement of temperature can also due to the
fact that lidar observation is done for one hour while the radiosonde is the
single data observation.
Figure 1. a)
Comparison of water vapour mixing ratio measured by lidar (-) and radiosonde
(), the cross symbol (+) shows the relative humidity. b) Temperature
measurements by using by lidar (-) and radiosonde (). Both are simultaneous
observation on Dec. 24, 2003. The horizontal bars in the Fig. 2b represent the
standard deviation from the mean profile.
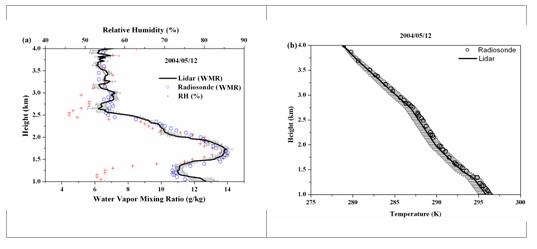
|
Figure 2. Same as Fig. 1a and 1b respectively but for May 12, 2004
|
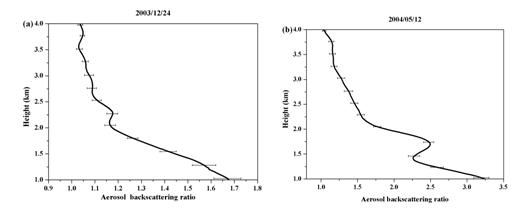
Figure 3.
(a) and (b) show the backscattering ratio profiles of aerosols measured
on Dec. 24, 2003 and May 12, 2004,
respectively. The horizontal bars represent the standard deviation
magnitude of the backscattering ratio during the period of measurement.
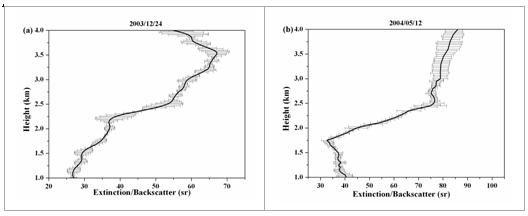
Figure 4. (a)
and (b) show aerosol extinction-to-backscatter ratio on Dec. 24, 2003 and May
12, 2004, respectively. The error bars show the variation of results during the
measurements.
2. Aerosols and
humidity analysis
Figs. 3a and 3b show
the aerosol backscattering ratio profiles for Dec. 24, 2003 and May 12, 2004, respectively.
The detailed calculation of aerosol backscattering ratio profile and the
definition of aerosols over Chungli, Taiwan has been reported in [3].
Figs. 4a and 4b show
the lidar ratios of aerosols derived from lidar for Dec. 24, 2003 and May 12, 2004,
respectively. Comparing Fig.1a and Fig.4a, show that smaller lidar ratio (<
35 sr) under higher RH (>70%) and the increase in lidar ratio with decrease
of RH. From Fig.2a and Fig.4b, it was observed that the lidar ratio is
distributed around 30-50 sr below 2 km, while the RH greater than 70%. The
observations also reveal the maximum RH (~85%) is corresponding with the
minimum lidar ratio (~32 sr) and showing the tendency of increasing lidar ratio
with decrease in RH. Both studied cases indicates that under drier environment
(RH<60), the lidar ratio varied within 50-90 sr. The distribution of lidar
ratio in different height with RH indicates the change in aerosol type or the
effects of RH on aerosol swelling. This result supported that aerosols begin to
swell when the RH increases above ~70% [12]. The profiles of the aerosol
backscattering ratio for both cases (Fig. 3a and 3b) showed similar tendency
with their WMR profiles (Fig.1a and Fig.2a) and indicates the correlation of
aerosols with humidity. This will cause the hygroscopic aerosols to grow which
will increase the scattering cross section of the aerosols and thus resulting
in the higher backscattering ratio.
V. SUMMARY
A coordinated
Raman-Rayleigh lidar system has been successfully developed and applied to
measure the vertical distribution of atmospheric water vapour, temperature and
the extinction-to-backscatter ratio of aerosols over Chungli, Taiwan. The
methodology was discussed in detailed for the retrieval process of the above
mention atmospheric parameter. The water vapour and temperature profiles
measured by lidar yields good agreement with radiosonde, but the former have
the advantage of better vertical and temporal resolution. By using the Raman
signal the lidar ratio is studied which is one of the important optical
parameter that can yield information about the physical nature of aerosols. The
quantification of this ratio has been demonstrated for the growth of aerosols
as a function of relative humidity. The profiles of water vapour are similar to
their backscattering profiles which indicate that the hydrophilic aerosols can
produce higher backscattering.
In any event, those
simultaneous intercomparisons provide a clear example of the quantitative
capabilities of the Raman-Rayleigh lidar technique for profiling atmospheric
water vapour, temperature and aerosols.
REFERENCES
1.
Ansmann A, Riebesell M, Weitkamp C., 1990. Measurement of atmospheric aerosol
extinction profiles with a Raman lidar. Optics Letters, 15: 746-748.
2. Chen W.N., Tsao C.C., Nee
J.B., 2004.
Rayleigh lidar temperature measure-ments in the upper troposphere and lower
stratosphere. J. of Atm. and Solar-Terr.l
Physics, 66: 39-49.
3. Chiang C.W., Chen W.M.,
Liang W.A., Das S.K., and Nee J.B., 2007. Optical properties of tropospheric aerosols based
on measurements of lidar, sun-photometer, and visibility at Chung-Li (25N,
121E). Atmosph. Env., 41: 4128-4137.
4. Cooney J.A., 1970. Remote measurements of
atmospheric water vapour profiles using the Raman component of laser
backscatter. Journal of Applied
Meteorology, 9,182-184.
5. Emanuel K.A., 1994. Moist thermodynamic
processes: Atmospheric convection. Oxford
Univ. press, New York, pp.107-117.
6. Evans K.D., Melfi S.H.,
Ferrare R.A., Whiteman D.N., 1997. Upper tropospheric temperature measurements with
the use of a Raman lidar. Applied Optics,
36: 2594-2602.
7. Hauchecorne A., Chanin
M.L., 1980.
Density and temperature profiles obtained by lidar between 35 and 70 km. Geoph. Res. Letters, 7: 565-568.
8. Keckhut P., Chanin M.L.,
Hauchecorne A., 1990.
Stratosphere temperature measurement using Raman lidar. Applied Optics, 29:
5182-5186.
9. Melfi S.H., Lawrence
J.D. Jr., McCormick M.P., 1969. Observation of Raman scattering by water vapour
in the atmosphere. Applied Phys. Letters,
15: 295-297.
10. Nee J.B., Thulasiraman
S., Chen W.N., Venkat Ratnam M., Narayana Rao D., 2002. Middle atmospheric
temperature structure over two tropical locations, Chung-Li (25N, 121E) and
Gadanki (13.5N, 79.2E). J. of Atm. and
Solar-Terr. Phys., 64: 13111319.
11. Saucier W.J., 1989. Principles of
meteorological analysis. Dover, 9.
12. Tang I.N., 1996. Chemical and size effects
of hygroscopic aerosols on light scattering coefficients. J. of Geoph. Res., 101:
19245-19250.
13. Whiteman D.N., 2003. Examination of the
traditional Raman lidar technique. II: Evaluating the ratios for water vapour
and aerosols. Applied Optics, 42:
2593-2608.